Since
June we have seen ACC Ltd souring high giving a profit around 23%. It is very
recent that I saw some unhealthy pattern forming in ACC Ltd as follows
1.
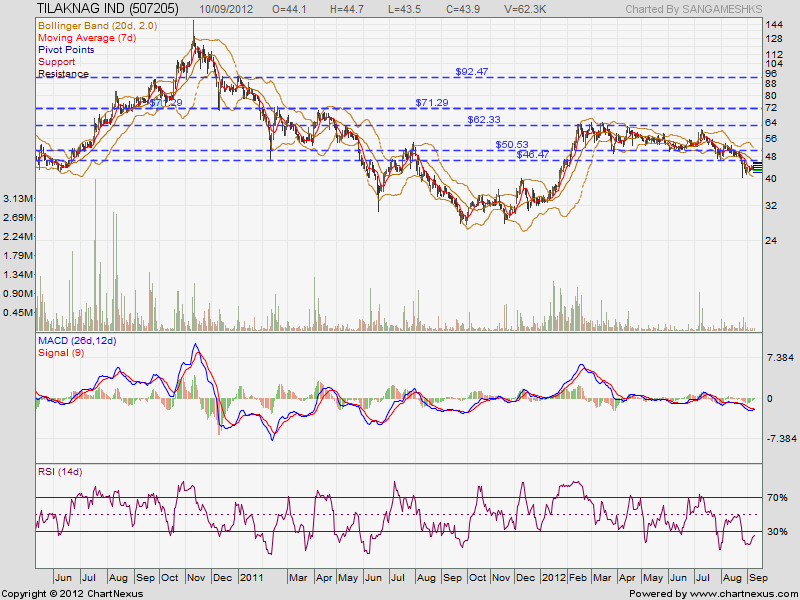
Rising
wedge: we are seeing a rising wedge pattern forming in ACC Ltd. We saw a bearish
breakout in this stock on August. After which we saw a bounce back at 1290. As per
know the stock is in a bearish condition.

2.
Divergence:
In spite the stock is making a HH, but MACD as well as RSI is not able to form HH
and we are seeing a HL thus forming a divergence in this stock.

Some important supports

Conclusion: The stock
is not looking bullish, we may see a consolidation within few days
+LTD.-800x600.png)