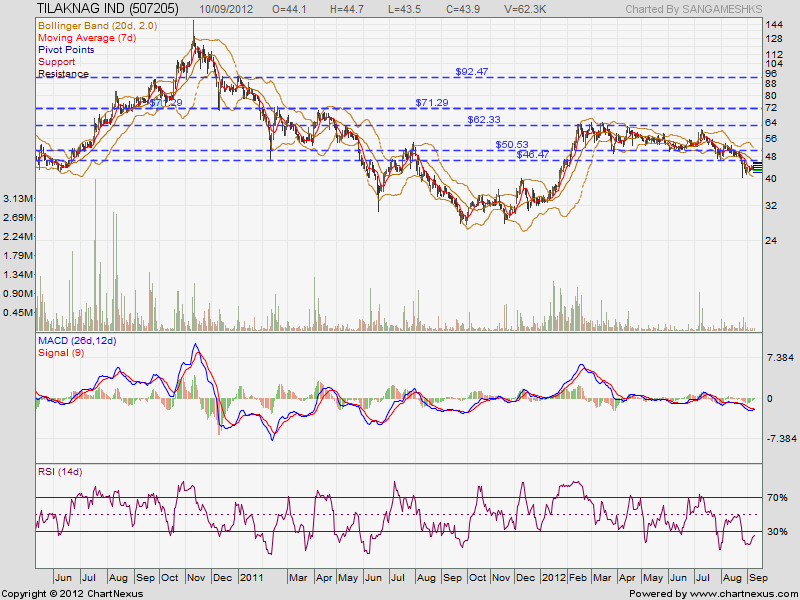
Disclaimers: This is completely a Knowledge based and Doesn't Contain any "Buy/Sell Tips".Stocks mentioned in this article are not to be viewed as recommendations for buying or selling."They are experiments" and they can move in either-way.
Monday, September 10, 2012
Wednesday, September 5, 2012
Breakout in Indicators
We always
know that Indicator is the reflection of a price. Whenever we see a
Bullish/Bearish Breakout in price we see a reflection on indicators. Yes, we
are seeing 2 H&S Pattern here in this stock. But I think the stock may not be
able to cross neckline. We have seen a Negative Breakout in RSI.
MY
Theory:
The
stock is going to consolidate around 770
later it may head to break that Neckline. “BUT NOT KNOW”
Tuesday, September 4, 2012
Sunday, August 26, 2012
Ashok Leyland, a falling wedge
After witnessing
Ashok making some lows, I smell some bullishness in this stock. It is recent; I
have spotted a falling wedge formation along with a divergence forming. According
to me, Ashok Leyland is going to make a new low then will get ready to shoot
high.
We have
recently seen MACD making a negative crossover and RSI giving a buy signal.
Conclusion: wait
till pattern complete, look for divergence.
Tuesday, August 21, 2012
Sunday, August 19, 2012
Technical View: Syndicate Bank
Syndicate
Bank is seeing attractive compared to stock like SBI. Technically, MACD is
about to make a positive crossover. The resistance at 98 is causing little
hiccup rest. Secondly, we have seen little violation in trend line.
If syndicate
bank is a bet know, it may help fetching some at least 9% profit.
Subscribe to:
Posts (Atom)