Showing posts with label Stock Market. Show all posts

Sunday, June 3, 2012

IVRCL: Not my bet!


Recently IVRCL stated showing sign of a possible reversal. I am sticking to my point saying “the stock is not having any potential to make a higher high.”

 We have seen correction more than expected. Which is eventually had affected the growth wave.


"Even though we have seen a bullish crossover(MACD) I stick to say, the stock have lost the potential  to mover higher."

 Last link on IVRCL:Click hear

Sunday, March 18, 2012

SENSEX: Some Interesting Facts


From very long days this support is working very crucial all the time. Before market makes a big move we have seen this type of violation as I have pointed it on my charts. I am bullish on market until the market maintains a bullish trend. Recently MACD was unable to give a positive signal, yet I am bullish because I feel market is likely to follow trend line. 

Saturday, March 3, 2012

Trading Triangles-Introduction


Triangles are some geometrical figures which are formed on charts. Unlike triangles having 3 point of contact, triangles in technical charts are formed when supports/resistance and tend line to meet at a single point.

Each triangle in charts comes with different shapes. Always triangles are classified under continuation pattern. The world “continuation” say that the trend is going to be same (uptrend or sideway or downtrend) and continue to follow the previous trend.
(Technical Analysis of Financial Markets by Jhon. J. Murphy, page no.129)


But, according to Edward and Magee in there book “Technical Analysis of Stock Trends 9th Edition”... they classify triangles under Reversal (Page99).


Why are triangles formed?
Its pure psychology that, a price of a stock always moves in a trend. And a trend has two different terms those are support and resistance. Some times the supports and resistance show some unusual variations forming a triangle.

 In every triangle there is one constant either it is support/resistance and the price form uptrend/downtrend forming a triangle, opposite to the constant line. (Except in symmetrical triangle).

What are the parts of triangle?
There are many types of triangles. But, there are few things common in them.. Those are as follows:


  • Support & Resistance (SAR): Every triangle has a support and resistance. The reason for these SAR helps you in many ways. Sometimes when a triangle fail to make itself a triangle. SAR plays a very important role, by showing the path of the triangles.


  • Uptrend/Downtrend line: It is one of the most important parts of a triangle because it shows the behaviour of a price action. This uptrend line also play a very important role in measuring the future price action of a stock.


  • Breakout Up/Down: when an uptrend line choreograph price action to break its support/resistance. The real sentiments of market play a real role and that’s the reason why we always see for a breakout. A breakout is always seen as a conformation of an uptrend/downtrend.


  • Throwback/Pullback: These are only seen when there are poor bullish/bearish sentiments in market. It is also an indication of a fail-break.

  • Gap: A gap is a gap in price movement of a stock. We normally see gaps during breakouts (some times even in Fail-breaks). There are various types of Gaps and the gap that we see during a breakout is a breakaway gaps.

  • Cardle: most of people never consider cardle an important tool. A cardle is a place where the S/R and uptrend/downtrend line meet. It is a point of collision of two lines. But according to few, a cardle is going to help us determine it as triangle or wedge. It is also called apex/ point of interaction.

Types of Triangle

There are 3 types of triangle namely..
·          Ascending triangle
·         Descending triangle
·         Symmetrical triangle

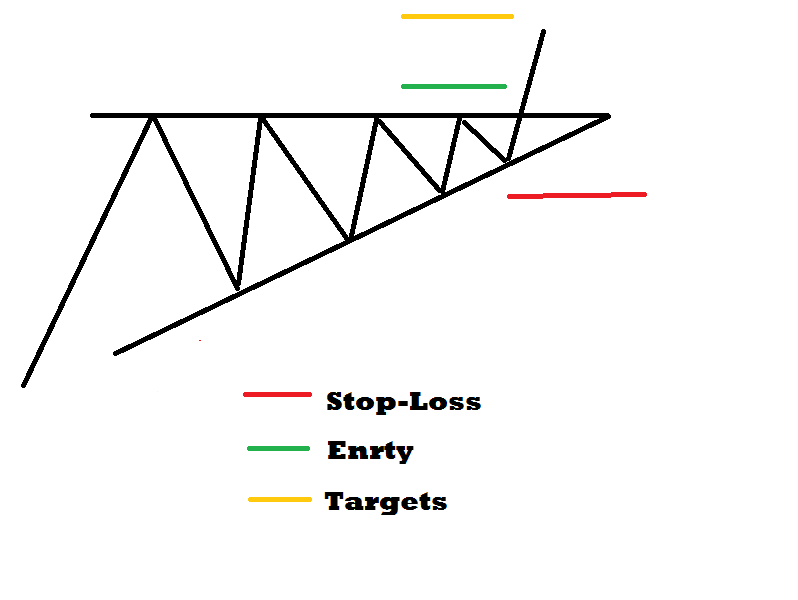
Art of placing Targets, Stop-loss and Entry in Triangles
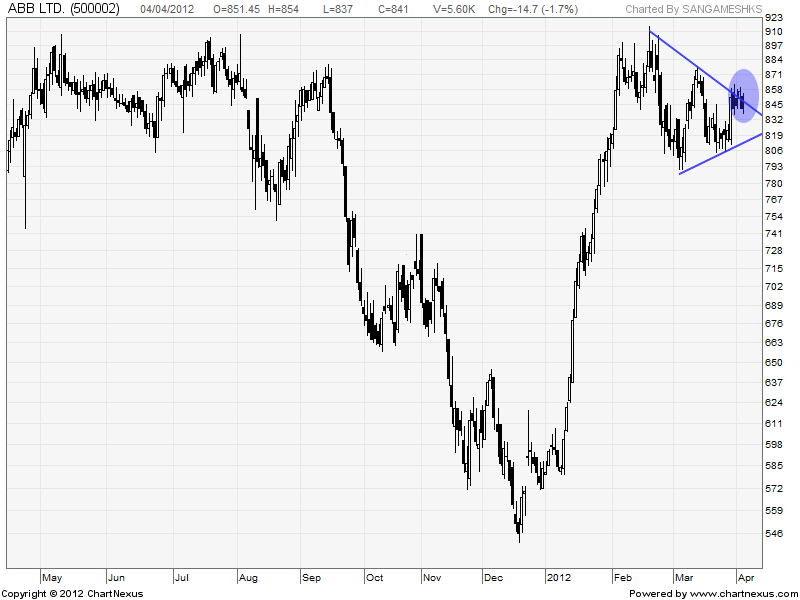
Ascending Triangle
Descending Triangle


To be  continued ....


Thursday, February 16, 2012

Sri Renuka Sugars


Predicting market isn’t “butter chicken” these days. But I have tried my best to answer your quire "What a student can answer" .. I have given you some levels which are going to be major supports and resistance (some magical levels which are going to be good tops and bottoms).. As you can see the stock had performed bad more than expected..

Right know I want to be neutral on Renuka sugar because MACD have shown bearish indication but, it can make sudden bullish indication.  After stock crossing 51 levels it is having multiple resistances.   

I am not “shy” to use the world “only a god can predict this stock”.. Apart crossing 100D-MA there is nothing positive about this stock..  More over all, market sentiments can change anytime. There is a kind of risk factor..

Note: Don’t buy/ sell any stock on recommendation from friends/relatives/a student like me.. Go with a proper analysis, risk reward ratio and most important a GOOD STOP-LOSS.

Monday, February 13, 2012

Chambal Fertz: saw a sudden reversal

In recent days Chambal had shown a negative cross-over by crossing 100D moving average.. later we have  witnessed a sudden reversal.  

Right know after seeing a reversal we are looking a breakout, 95.55 is standing a major resistance for Chambal Fertilizer & chemicals. as per know Chambal opened with a gap later it filled it.. it is pretty risky, better to hook after a breakout

Thursday, January 12, 2012

ITC: is thr any breakout?


Geometric Ltd: what did i say?


i had informed everyone that we will see a reversal. i had told this "not once but twice".

What did i say?
It is around a month i had told that Geometric Ltd will go into a correction and head for a higher high. yes my dear friends i was right and the stock moved as i had predicted.

What's new?
there is nothing new for know. nor i had posted this to predict a reversal nor continuation. just to say that i am right.

Tuesday, January 3, 2012

Tata Motors: Breakout in Symmetrical Triangle


 I was looking for this for more than 15days month. Know we have seen a positive breakout in the Symmetrical Triangle. As this is my 1st time working on symmetrical triangle I don’t want to take any risk. I have gone with a stop loss of 184 and hooked Tata Motors

I have started working on targets.

“I hope my measuring technique is correct. I feel it’s better to use fib lines to identify the resistance of Tata Motors” 

Thursday, December 29, 2011

Tata Steel: Regular Bullish Divergence

No one trusted me when i told i found a reversal. I am still bullish. the reason to be bullish is because we have seen  some divergence in TATASTL. we may expect some positive sentiments in market.  

Hear tata stl is making LL, but MACD is making HL. As the divergence is not strong. we need to play with "Caution" 

statuary warning: Go with a Stop Loss. As I have told you "I am not playing for Profit, I am playing for my EGO". profit doesn't matter. you are picking a stock with downtrend. so risk is very high.

Sunday, December 25, 2011

Tata Steel: Updated Version


Hello friends a month back I have spotted the reversal and told you that I am “neutral” on buying Tata Steel. There wear many reasons to be neutral. But I have told you that “Tata Steel is in a downtrend, and follow the channel”. Tata Steel doesn’t reach your support and resistance. Thus caused a bit nervous and confused but, I was right saying Tata Steel in downtrend.


Today I am once again back saying I have once again spotted a reversal. This time it’s not “Profit Factor” it’s “EGO Factor”.

This time I am playing Tata Steel with targets of 370/375/380+. SL 340

Note: When you are uncertain in buying any stock “Never Buy”. It not only creates confusion, it leads you in a state of “Panic”, which cause you to make low profit, sometimes loss. I have avoided Tata Steel as was not confident in buying.

Saturday, December 24, 2011

Must see: If u want to b a Trader/Investor in Stock Market?


Hi friends this is documentary that I had seen around 6 months ago. and this is one such video which created a curiosity to know more and more. If you want to enter into such market you need Right Talent, Intelligence and  Knowledge. It is recommended that before entering any market you should need to know the insight view of it. And this video do say that.


This video is quit lengthy and some of my friends had felt boring to see this, so i recommend to see this with a curiosity. I hope this video will obviously through some light.

Thursday, December 22, 2011

Reliance Industries Ltd: catching a falling knife


There is no reason to be bullish.. Yes I am confident in saying that. From last few days we have seen ril.bo in downtrend. Know we have not seen any sign of a “reversal”. It is better to stay away from this stock.

If reliance manage to break that downtrend channel. We may think to hook it. As per know “avoid it”

Tata Motors: Waiting for breakout


90% I am bullish, 10% I am not.

We have seen a bullish crossover in MACD, where we have seen 2 main possibilities for buying. I can blindly buy, but I am waiting for “c”. If we see a positive breakout then it is a potential buy. I have not willing to take a risk as it is my 1st time playing with “Symmetric Triangle”

We have seen a potential crossover
MACD: we have seen a positive crossover
MACD: zero line/centre line crossovers

Monday, December 19, 2011

Tata Motors: looking good

A symmetrical triangle.

I hope I have got it right this time.

Yes, I have clarified. It's a Symmetrical Triangle.