Friday, October 19, 2012

Technical Analysis on request: MIC

This stock showed a bullish pattern, a pattern called “Falling Wedge”. As there is a low volume and lack of interest we have seen this stock not performing well at the current level.


Risk involved in this stock: I see a risk in this stock, the stock is currently sliding down through the trend line. Technically the stock isn’t looking strong as per know. So, I recommend Bottom Fishing for this stock.


Analysis on Biocon

I need to be back by 8th October. But there was some delay in my college admission due to which I was not able to keep on updating markets. I had a constant eye over markets movement and everything went on as per my calculation. September was a good time. Most of my stock gave a 12-50% return and it was pretty good compared to last time (Nov2011) which gave 12& 35% return from 2 stocks.

It’s over a couple of days that Biocon is looking potentially good and the reason are as follows:

  • Candle-Stick Analysis: As per know we are not seeing any bullish stick forming but from last 2 days there is a positive action from market side.
  • Indicators: Both the indicators MACD as well as RSI is showing some divergence. Along with it we are seeing MACD very near to 0 line. And I personally feel that it may show some bounce.


  • Moving Average:

  1. 7DMA-Bearish
  2. 20DMA-Bearish
  3. 50DMA-Bullish
  4. 100DMA-Bullish
  5. 200DMA-Bullish
Crossovers: we have seen Golden Crossover along with that we are about to see a crossover of 100&200DMA. Most of all MA are bullish except 7&20DMA which  can be ruled out.


  • SAR:


Conclusion: The stock is has shown a good support for 50DMA. Indicators like MACD and RSI are showing some bullish divergence. MACD is very near to its zero level and I expect some bounce. if we witness a reversal, the swing that we see will be not much more that 16%.  If the stock continue to fall  257 will stand as a good support, if not 243.

Strategy: Can take a risk to grab with a good stop-loss  


H&S Pattern in Axis Bank


Sunday, September 23, 2012

Analysis on PVR Ltd


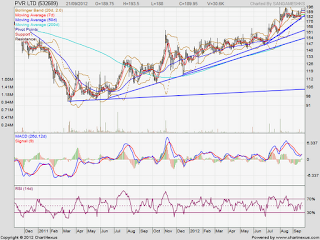
PVR Ltd is a technically sound company. It is on a bullish trend since June 2011. In spite markets ups and lows the stock had performed well with respect to market.

 The reasons are as follows:
  •              Candle-Stick Pattern: we have seen a Morning Star on last Friday.
  •       Indicators & Divergence: MACD is about to give a Bullish Cross-over. Along with that we are seeing a Bullish divergence. And RSI is neutral.
  •       Moving Averages: All the moving averages are giving a clean way for this stock to sore high. We have seen a golden crossover in September 2011.
  •        SAR: we have seen a recent resistance turning as a support @188. The next resistance is at 203 and so on.
  •      Chart Pattern: From July 2012 we have been seeing this stock making a Bump and Run Continuation. According to me we are expected to see a 2nd Bump and Run Continuation.


·         Conclusion: This stock was bullish for a year and it is showing a continuation. The stock is on a bullish run will continue not more that 3-6 months. The stock is at high and expected to make a higher high.

Saturday, September 22, 2012

Technical view on ABB Ltd

It is a long time that I left ABB Ltd, I thought it is not having any upside potential. The stock is near to its high and I was looking for a better pattern to form in this stock. During a recent analysis I found some positive potential things which can kick this stock high, and they are as follows:
  • Candle-Stick Pattern: On Friday, we witnessed a  engulfing pattern in this stock.

  • Indicator&Divergence: The stock price has been making a LH and we are seeing RSI making HH along with that we have seen RSI being sentimental to 30&70% buy and sell levels. Which is an indication that the stock may fall in further days. On other hand we are about to see a MACD zero-line crossover. If we see this happening we may find this stock on bullish side.

  • Trend-line and SAR: The stock is having a resistance around 767/823/873 and the stock is having a recent support between 700-710. The trend-line is also posing a hurdle for this stock.

  • Fibonacci levels:

  • Conclusion: if we seen this stock crossing above 770 we can surly make a profit of 10-12% with a span of 2-3 months. A caution is recommended as this stock is sentimental with RSI's 30&70% levels. we have recently seen this stock above 70%. Have an eye on divergence


Wednesday, September 19, 2012

ACC Ltd

Since June we have seen ACC Ltd souring high giving a profit around 23%. It is very recent that I saw some unhealthy pattern forming in ACC Ltd as follows

1.      Rising wedge: we are seeing a rising wedge pattern forming in ACC Ltd. We saw a bearish breakout in this stock on August. After which we saw a bounce back at 1290. As per know the stock is in a bearish condition.

2.      Divergence: In spite the stock is making a HH, but MACD as well as RSI is not able to form HH and we are seeing a HL thus forming a divergence in this stock.


Some important supports


Conclusion: The stock is not looking bullish, we may see a consolidation within few days