Showing posts with label BSE. Show all posts

Friday, November 2, 2012

An analysis on Pantaloon Re


The key things that are attractive for me are as follows:
  • MACD cross-over
  • Divergence in RSI
  • Breakout in price level
Conclusion:  If we see this stock crossing 196 we can see this stock heading towards 226 which will yield around  12% to 15% profit.

Friday, October 19, 2012

Analysis on Biocon

I need to be back by 8th October. But there was some delay in my college admission due to which I was not able to keep on updating markets. I had a constant eye over markets movement and everything went on as per my calculation. September was a good time. Most of my stock gave a 12-50% return and it was pretty good compared to last time (Nov2011) which gave 12& 35% return from 2 stocks.

It’s over a couple of days that Biocon is looking potentially good and the reason are as follows:

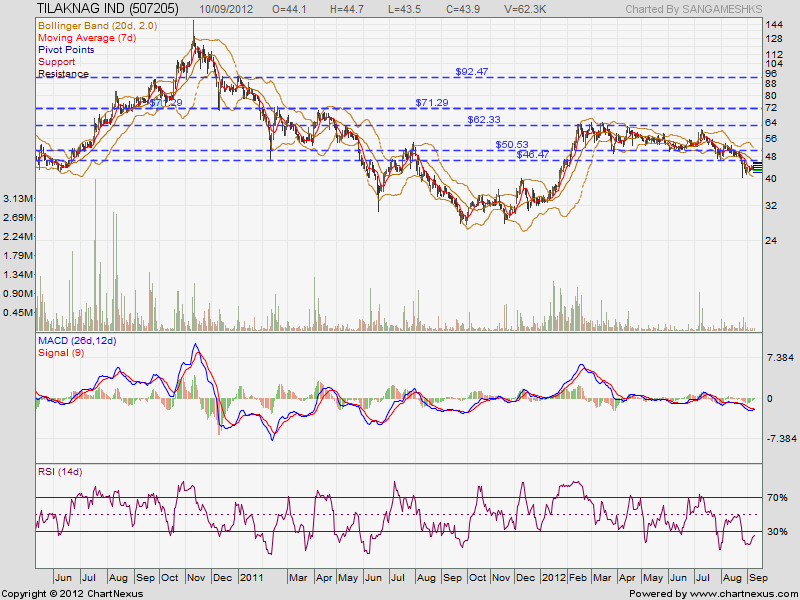
  • Candle-Stick Analysis: As per know we are not seeing any bullish stick forming but from last 2 days there is a positive action from market side.
  • Indicators: Both the indicators MACD as well as RSI is showing some divergence. Along with it we are seeing MACD very near to 0 line. And I personally feel that it may show some bounce.


  • Moving Average:

  1. 7DMA-Bearish
  2. 20DMA-Bearish
  3. 50DMA-Bullish
  4. 100DMA-Bullish
  5. 200DMA-Bullish
Crossovers: we have seen Golden Crossover along with that we are about to see a crossover of 100&200DMA. Most of all MA are bullish except 7&20DMA which  can be ruled out.


  • SAR:


Conclusion: The stock is has shown a good support for 50DMA. Indicators like MACD and RSI are showing some bullish divergence. MACD is very near to its zero level and I expect some bounce. if we witness a reversal, the swing that we see will be not much more that 16%.  If the stock continue to fall  257 will stand as a good support, if not 243.

Strategy: Can take a risk to grab with a good stop-loss  


H&S Pattern in Axis Bank


Sunday, September 23, 2012

Analysis on PVR Ltd


PVR Ltd is a technically sound company. It is on a bullish trend since June 2011. In spite markets ups and lows the stock had performed well with respect to market.

 The reasons are as follows:
  •              Candle-Stick Pattern: we have seen a Morning Star on last Friday.
  •       Indicators & Divergence: MACD is about to give a Bullish Cross-over. Along with that we are seeing a Bullish divergence. And RSI is neutral.
  •       Moving Averages: All the moving averages are giving a clean way for this stock to sore high. We have seen a golden crossover in September 2011.
  •        SAR: we have seen a recent resistance turning as a support @188. The next resistance is at 203 and so on.
  •      Chart Pattern: From July 2012 we have been seeing this stock making a Bump and Run Continuation. According to me we are expected to see a 2nd Bump and Run Continuation.


·         Conclusion: This stock was bullish for a year and it is showing a continuation. The stock is on a bullish run will continue not more that 3-6 months. The stock is at high and expected to make a higher high.

Saturday, September 22, 2012

Technical view on ABB Ltd

It is a long time that I left ABB Ltd, I thought it is not having any upside potential. The stock is near to its high and I was looking for a better pattern to form in this stock. During a recent analysis I found some positive potential things which can kick this stock high, and they are as follows:
  • Candle-Stick Pattern: On Friday, we witnessed a  engulfing pattern in this stock.

  • Indicator&Divergence: The stock price has been making a LH and we are seeing RSI making HH along with that we have seen RSI being sentimental to 30&70% buy and sell levels. Which is an indication that the stock may fall in further days. On other hand we are about to see a MACD zero-line crossover. If we see this happening we may find this stock on bullish side.

  • Trend-line and SAR: The stock is having a resistance around 767/823/873 and the stock is having a recent support between 700-710. The trend-line is also posing a hurdle for this stock.

  • Fibonacci levels:

  • Conclusion: if we seen this stock crossing above 770 we can surly make a profit of 10-12% with a span of 2-3 months. A caution is recommended as this stock is sentimental with RSI's 30&70% levels. we have recently seen this stock above 70%. Have an eye on divergence


Wednesday, September 19, 2012

ACC Ltd

Since June we have seen ACC Ltd souring high giving a profit around 23%. It is very recent that I saw some unhealthy pattern forming in ACC Ltd as follows

1.      Rising wedge: we are seeing a rising wedge pattern forming in ACC Ltd. We saw a bearish breakout in this stock on August. After which we saw a bounce back at 1290. As per know the stock is in a bearish condition.

2.      Divergence: In spite the stock is making a HH, but MACD as well as RSI is not able to form HH and we are seeing a HL thus forming a divergence in this stock.


Some important supports


Conclusion: The stock is not looking bullish, we may see a consolidation within few days


Wednesday, September 12, 2012

Breakout in Falling Wedge, Ashok Leyland


It’s a couple of weeks ago I had told you regarding a Falling wedge pattern forming on Ashok Leyland along with divergence. We had seen a Breakout yesterday, I expect a rally.   

The Resistance are as follow

Previous article on Ashok Leyland: Click Hear

Tuesday, September 11, 2012

Praj Industries, Bulls Waiting


It’s a long downtrend for Praj Industries one of Rakesh jhunjhunwala stock. After a long fall I just spotted a Divergence in this stock along with few attractive things, RSI is below 30 and MACD is about to make a Positive crossover. Market sentiments on this stock isn’t so good but worth caching it above 45 for a long or medium term

 For me 50/57/67 look good resistance for the stock


Monday, September 10, 2012

Tilaknagar Industries, Technically Strong


We have recently seeing a Regular Bullish Divergence in RSI along with it we are seeing a Bullish Crossover in MACD. For Tilaknagar Industries there is a good resistance at 46, so we can take it as a conformation and start hunting for this stock.


The Targets for the stock are as follows


Tuesday, September 4, 2012

Three reason, why Tata Steel look attractive?


Reason one: Recently we have seen Tata Stl making a bullish engulfing
Reason two: RSI is giving a buy signal
Reason three: Divergence in both RSI and MACD making this stock an attractive one.

Sunday, August 26, 2012

Ashok Leyland, a falling wedge


After witnessing Ashok making some lows, I smell some bullishness in this stock. It is recent; I have spotted a falling wedge formation along with a divergence forming. According to me, Ashok Leyland is going to make a new low then will get ready to shoot high.
We have recently seen MACD making a negative crossover and RSI giving a buy signal.

Conclusion:  wait till pattern complete, look for divergence.  


Tuesday, August 21, 2012

Eye on Tata Moters


After Tata Motors tumbling down we saw it taking a reversal and know currently ruling between 203-247.  It is a one of the important day for Tata Motors, today. If Tata Motors is able to cross 247 we may see the stock heading towards 274. 

Sunday, August 19, 2012

Technical View: Mastek Ltd


The company is bullish and look attractive. The company had recently broken one of its resistance and heading high. My 1st target is around 190 and 2nd at 210.  The company is expected to give a profit of +20%


Technical View: Syndicate Bank


Syndicate Bank is seeing attractive compared to stock like SBI. Technically, MACD is about to make a positive crossover. The resistance at 98 is causing little hiccup rest. Secondly, we have seen little violation in trend line.  
If syndicate bank is a bet know, it may help fetching some at least 9% profit.

Friday, August 17, 2012

Technical View: Bharathi Airtel


Bharathi Airtel looking too week is in a down trend, but on a keen observation I found every time it make a new low we saw a consistence throw back giving a profit of 12-23%.
Smart traders can make profit “Holding a falling knife”


*T&C APPLY 


Thursday, August 16, 2012

TA on Request: Jain Irrigation


Jain irrigation according to me doesn’t look profitable and lack with upside potential. When I look over technical it is not bad until and unless it is below 76, if Jain irrigation manage to come below 76 it is going to break the latest bullish trend.
Jain irrigation is having a support at around 74-75. If it fails to manage that support. It is going to follow the downtrend as shown.
  

Additional Information:
Jain Irrigations Ltd: JPMorgan has an underweight on Jain Irrigation and they have slashed the target to Rs 65 from Rs 105. The revenue flow from their micro irrigation business has started to shrink and the balance sheet matrix has not shown any improvement. As a result the debt on the books remains high.

Source: Economic Times 

TA on Request: RIL


The reason why I asked you not to sell Ril?
According to me you made a quick hurry. Reliance had just crossed one of its resistance. I had told you it is having potential to yield you minimum of 7% profit. Today reliance traded with a pretty good volume


Technical View: Rcom


After looking around 10 trading days I think Rcom has finally found its support. Yesterday, we witnessed a MACD crossover. According to me RCOM is looking a “Technically best buy” at these levels.